
The Flow editor
It follows your system, light or dark, and each picture below is shown both ways,
light first. Every picture below comes from web/shots/screenshots.sh, which starts the real binary
and a real browser, so they get retaken when the editor changes and can’t drift
into a mockup. The plant on the canvas is an oven line with two deployments
behind it.
Wire it, run it, watch it
Section titled “Wire it, run it, watch it”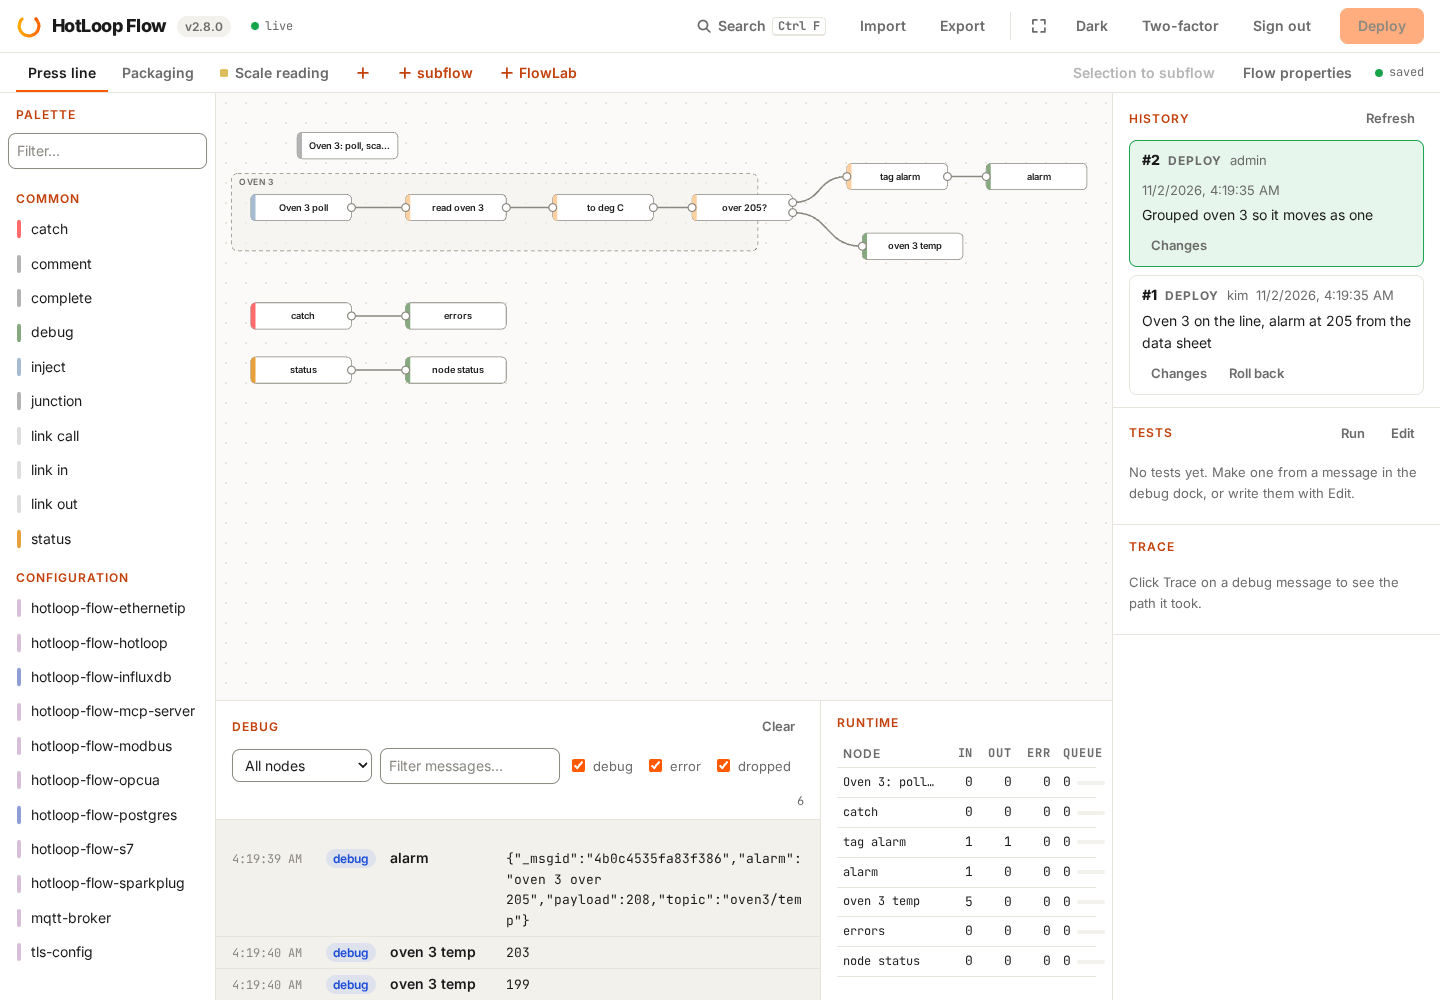
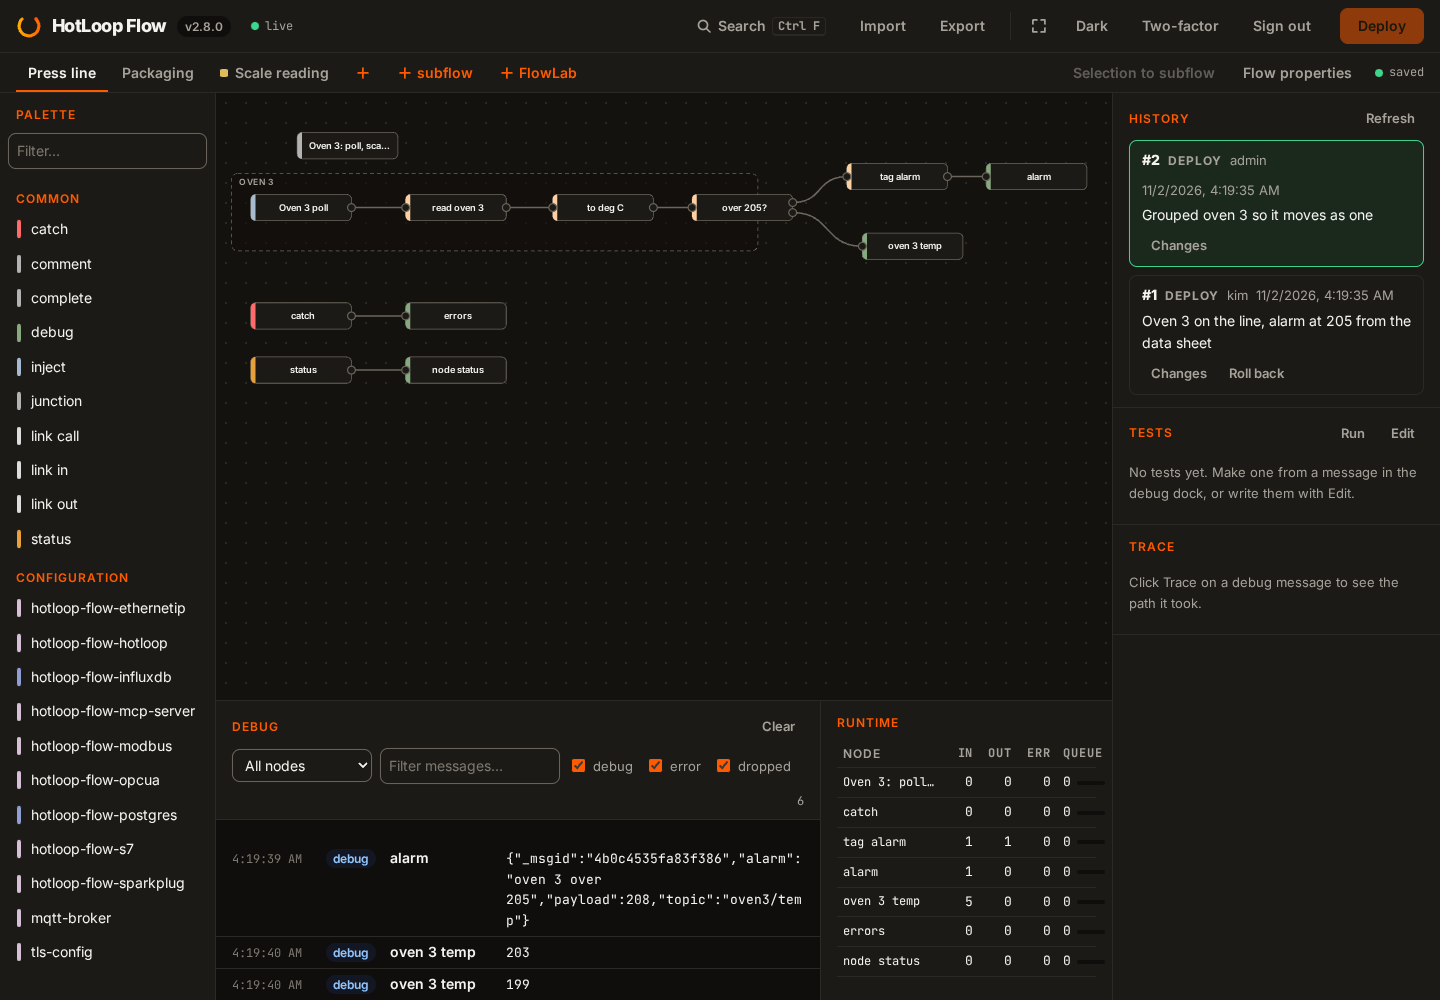
The canvas is what’s running. The debug dock under it prints what your debug nodes see, and the Runtime table beside it counts what went into and out of every node, with a bar for how full its queue is. When a line misbehaves you read it off the screen instead of going digging in a log.
Review it before it reaches the line
Section titled “Review it before it reaches the line”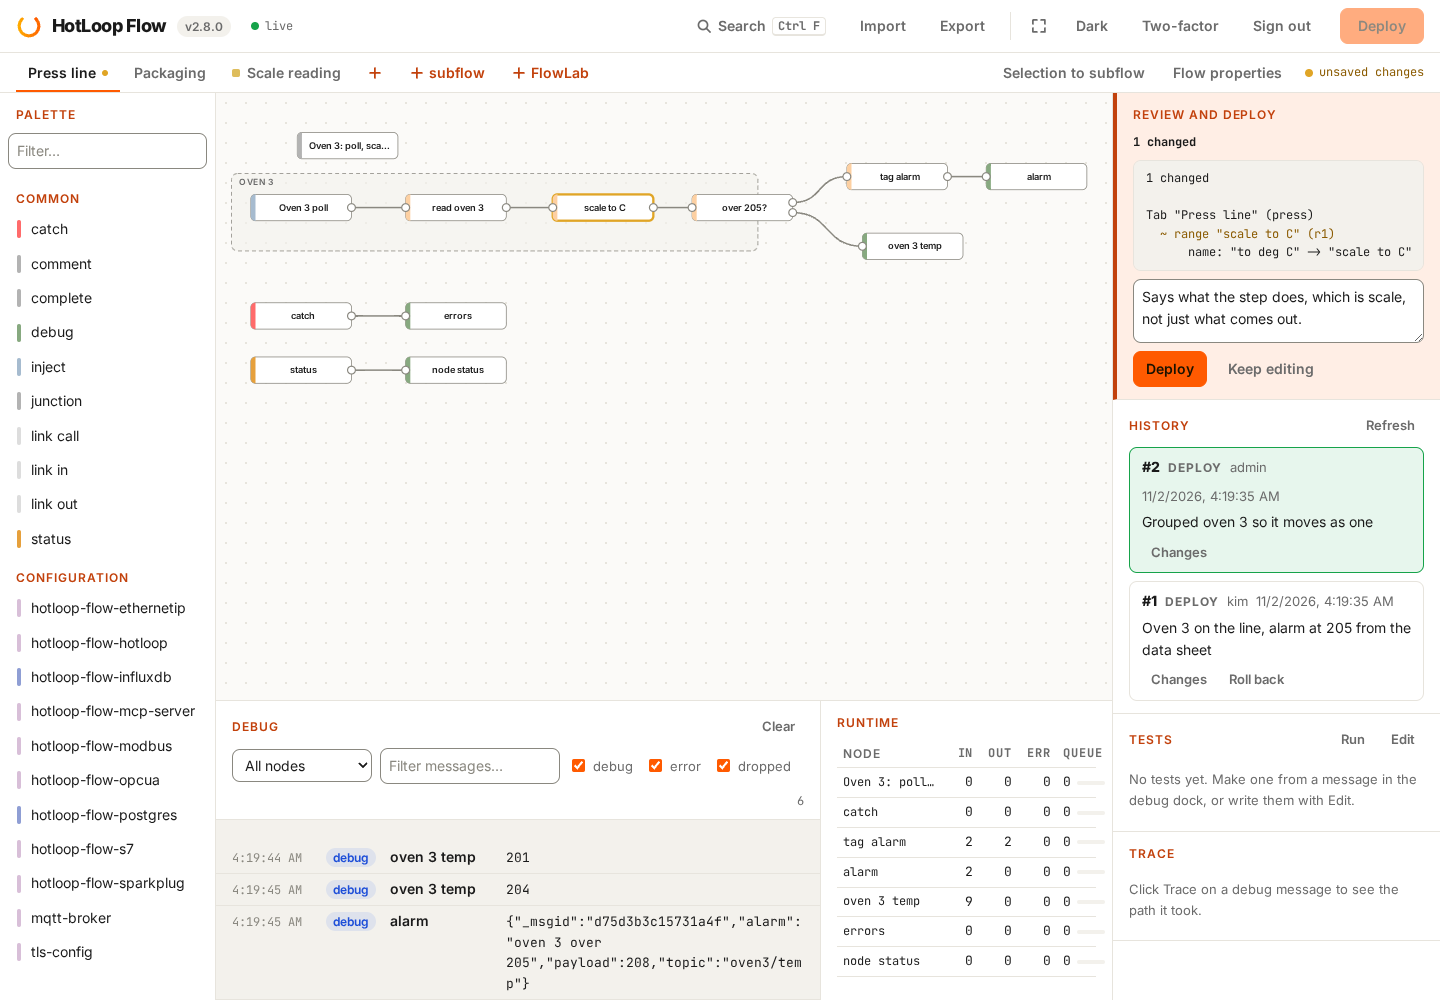
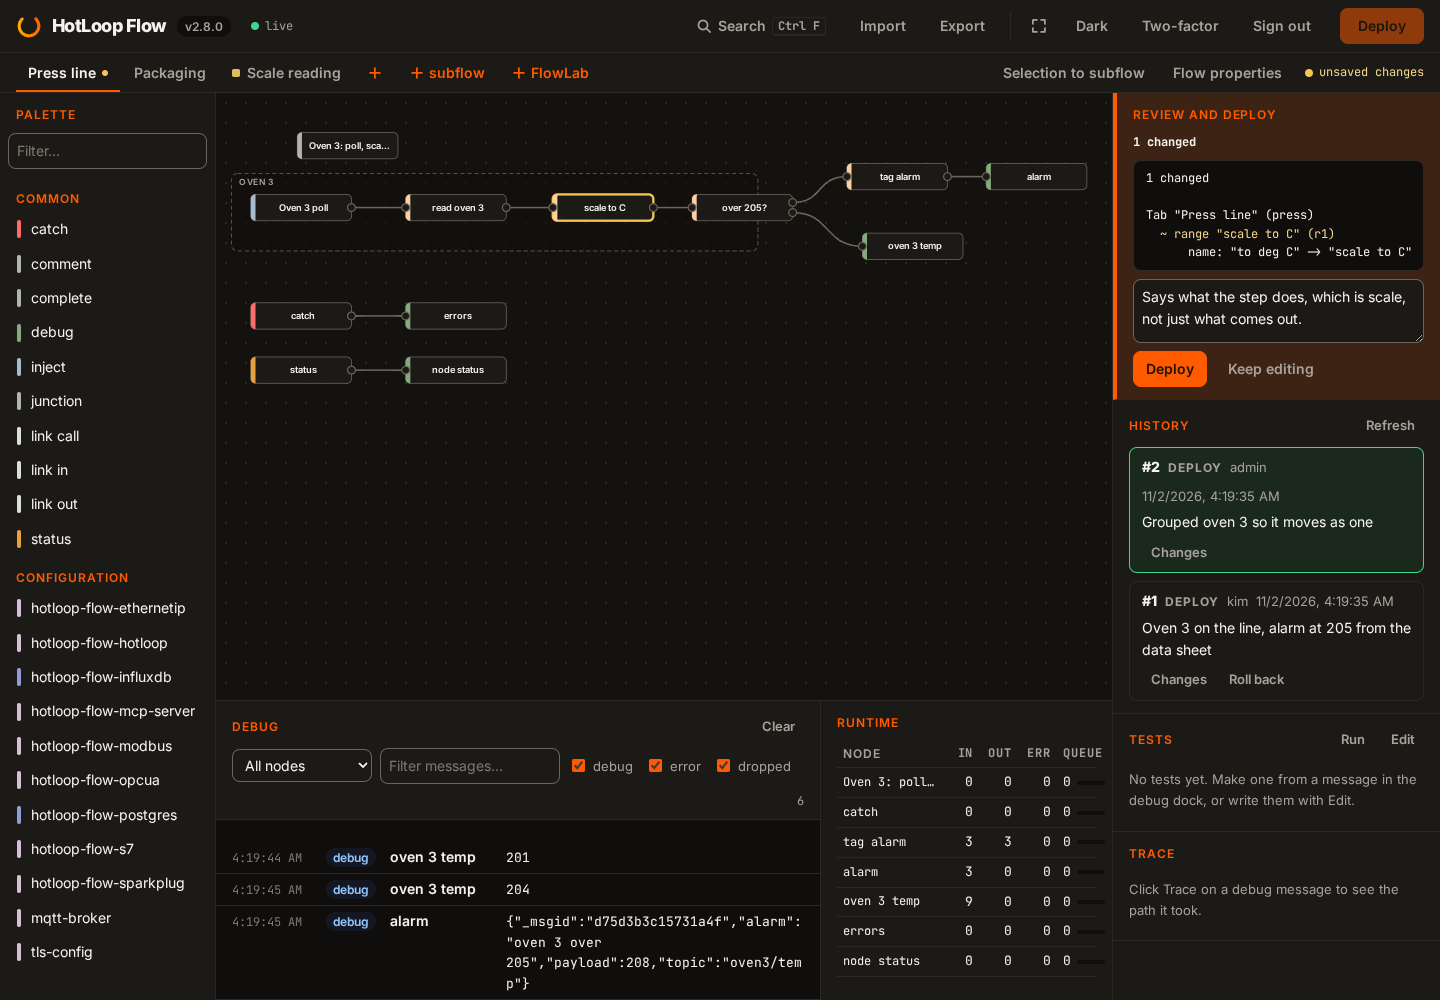
Deploy doesn’t deploy. It draws the change on the canvas, writes it out in words, and asks you for a note. The note lands in the history beside your name, so whoever gets the call at 2 a.m. can see what changed and why.
Follow a message down the wires
Section titled “Follow a message down the wires”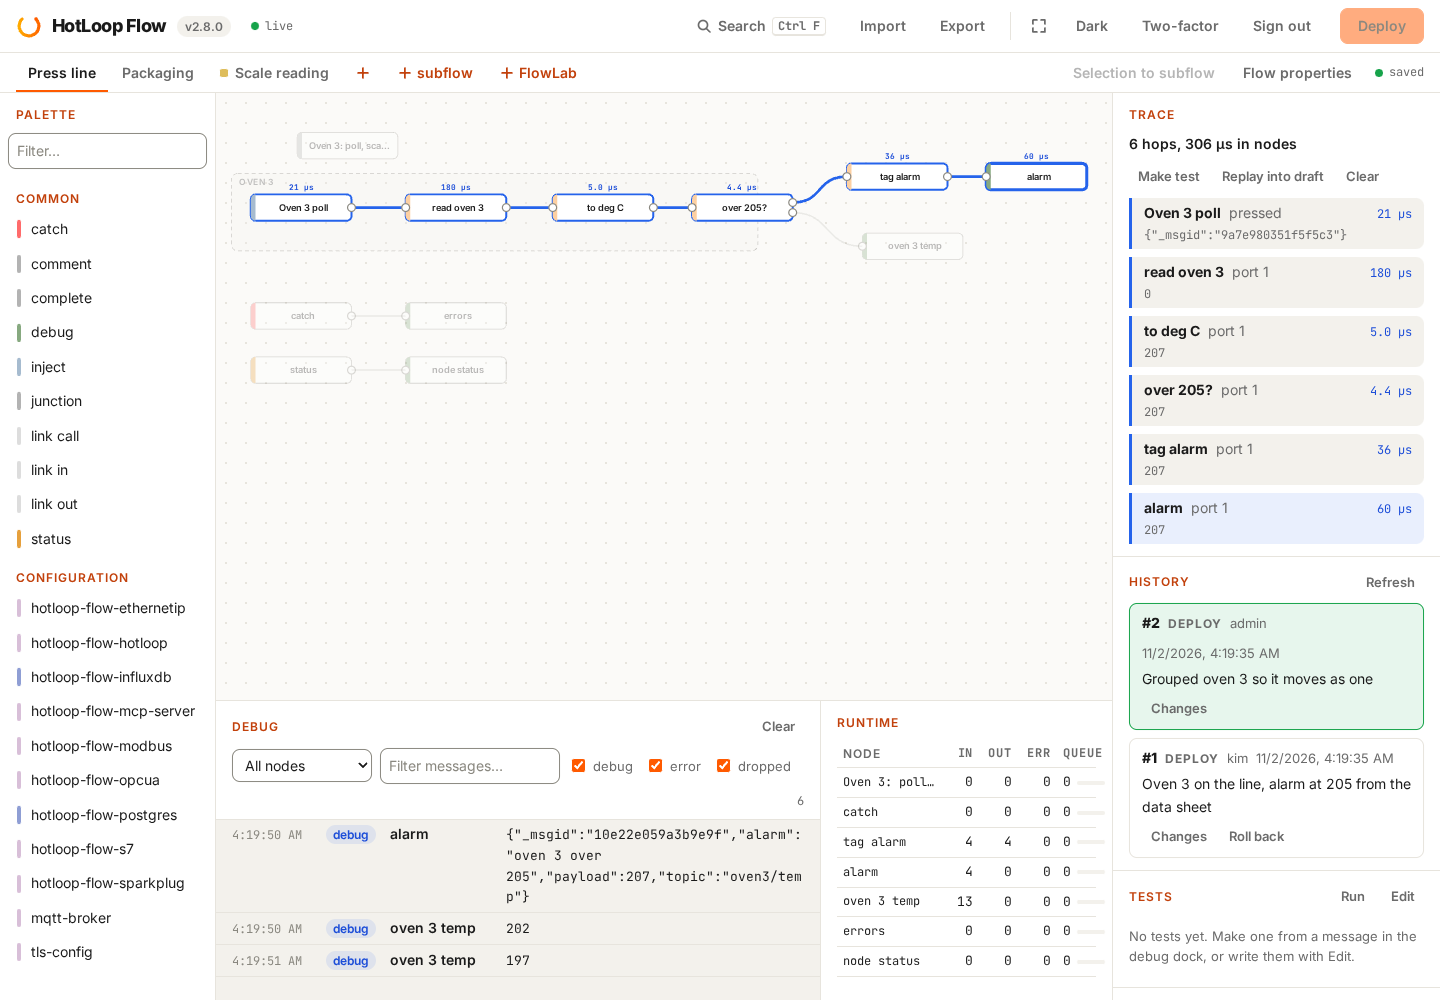
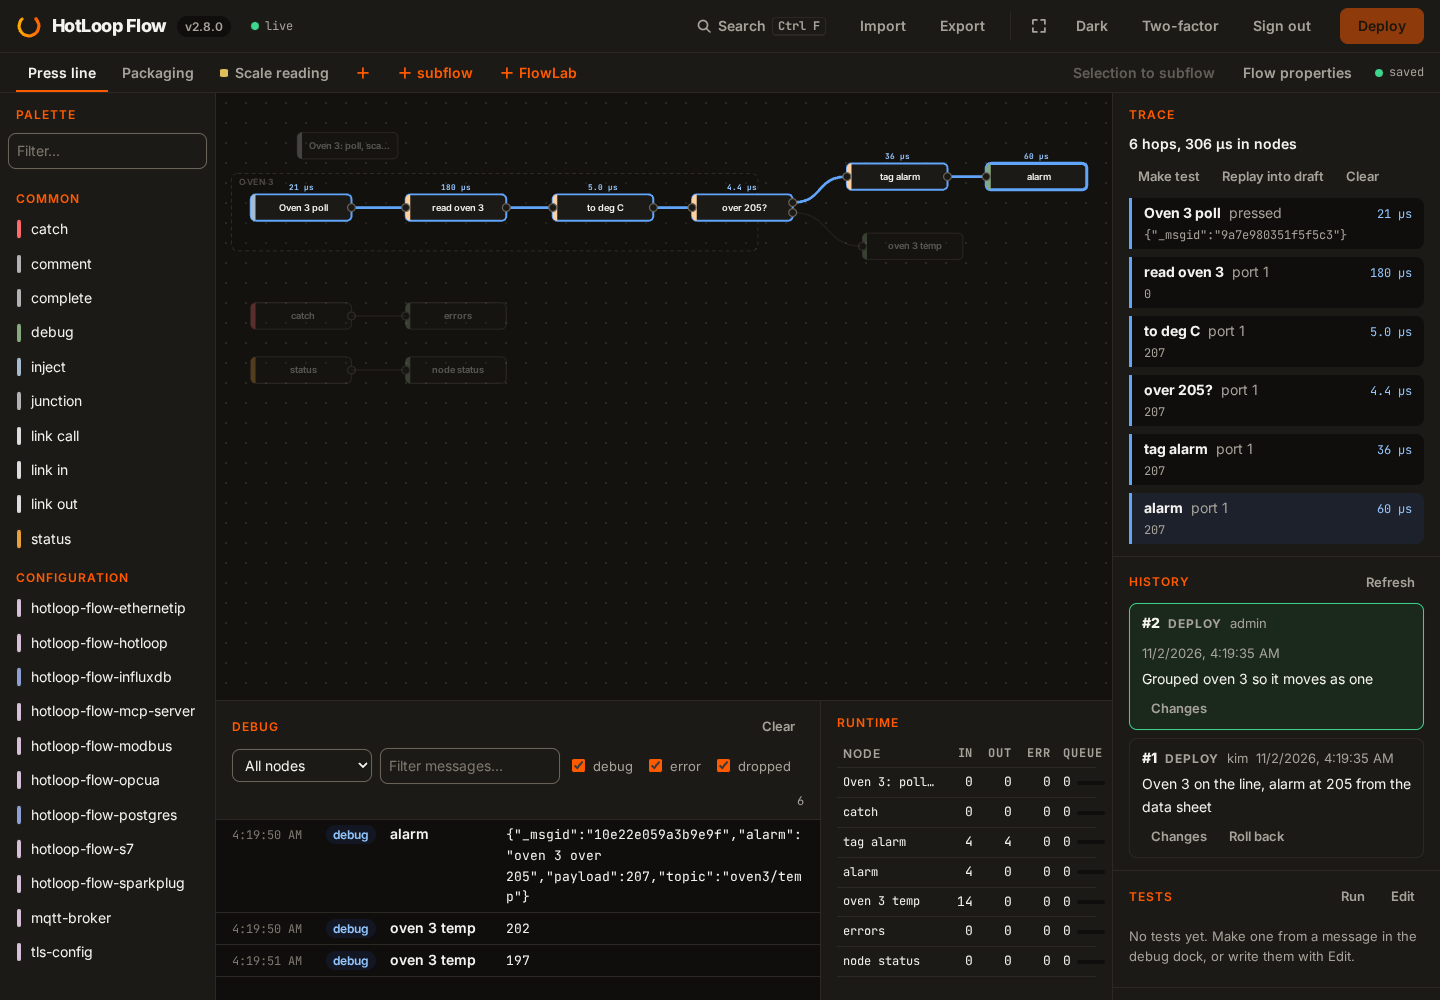
Click Trace on a debug line and the path that message took lights up across the canvas, hop by hop, with what each node did to it and how long it took. Turn it into a test, or replay it into a draft, from the same panel.
Signing in
Section titled “Signing in”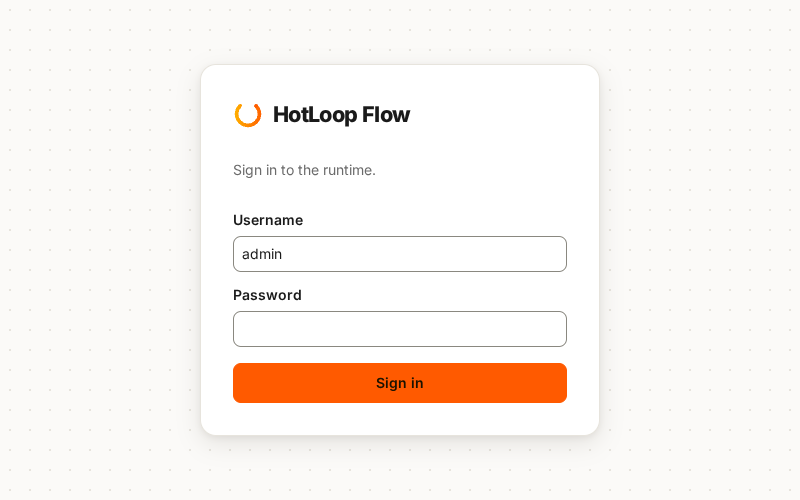
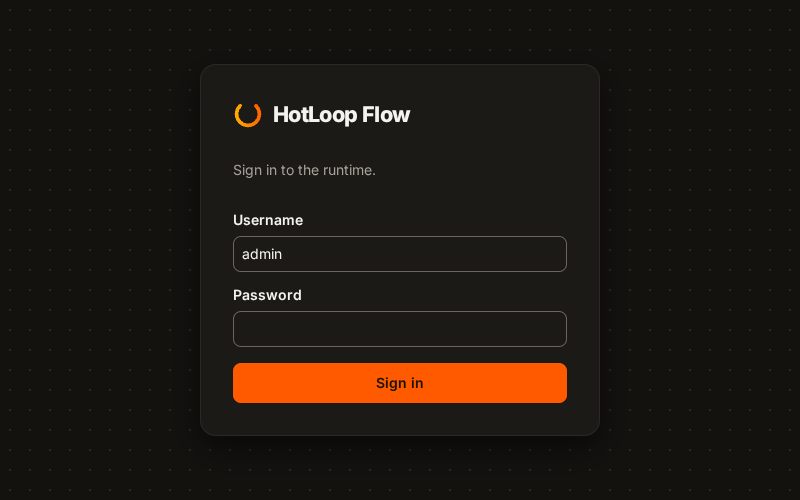
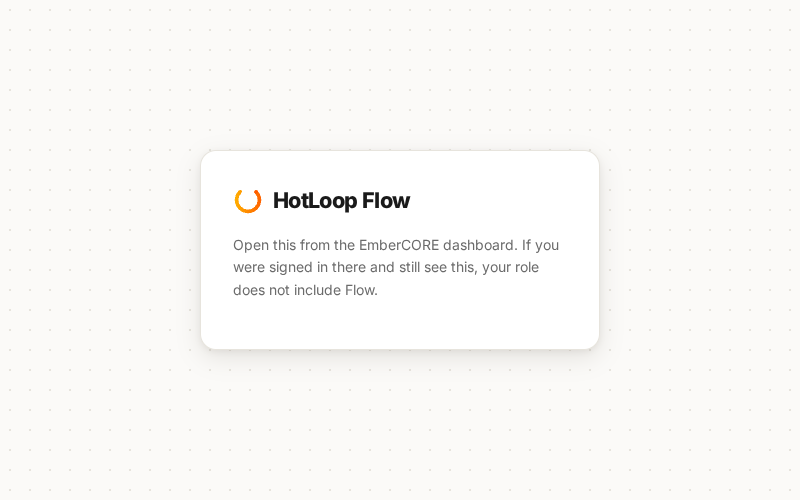
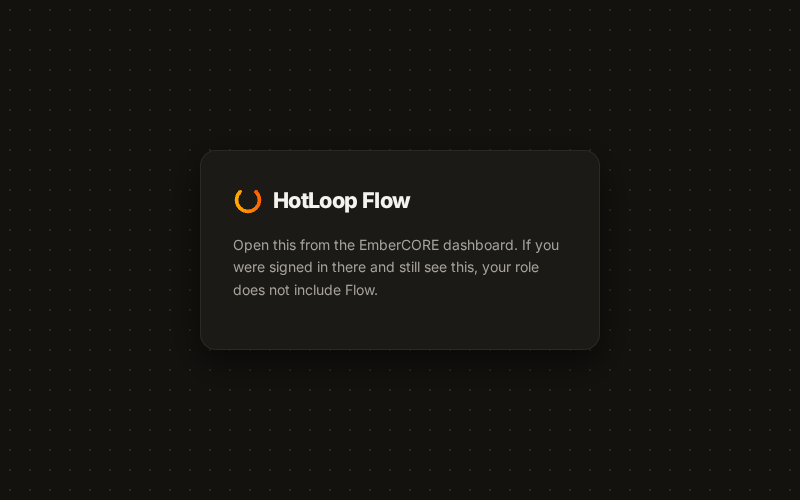
It won’t start unlocked, so the first thing anyone sees is a sign-in. When the EmberCORE dashboard signs people in, a runtime opened any other way says to come in through the dashboard instead of asking for a second password.